


ARTEMIS
White matter hyperintensity characterization
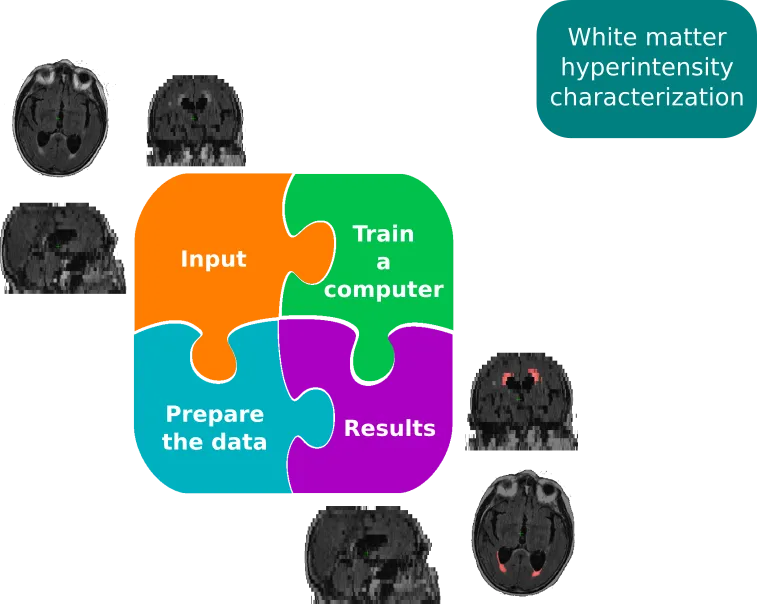
In the first aim of this project, we set out to characterize white matter hyperintensity lesions in large scale cohorts. The full scientific publication is freely available here. In order to do so, we developed a high throughput, fully automated pipeline, which outlines these very bright areas in the magnetic resonance image. White matter hyperintensities are considered to be a small vessel disease in the brain and the volume of these lesions have been linked with negative outcome after stroke, as well as negative cognitive effects. While a variety of methodologies exist to outline these lesions on high-resolution (research quality) scans, the application to clinically acquired images, e.g. in the emergency room, has proven difficult. Therefore, dedicated pipelines are necessary to handle this largely untapped potential of clinical information. While it might seem simple to just acquire higher resolution scans, the added time requirements can be detrimental, in particular in the acute phase of stroke patients. The first part of this aim, therefore, was the creation of a processing stream which allows us to utilize a deep learning framework for automated lesion segmentation, while taking the spatial distribution of the disease into account, and which allows us to fully utilize clinical scans.

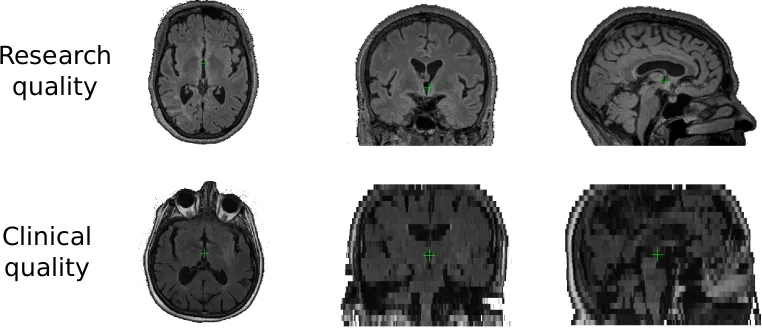
With the help of the MRI-GENetic Interface Exploration (MRI-GENIE) study, a large, international, multi-site study of acute ischemic stroke patients, we were able to pool scans of over 2,700 patients, which helped us in our efforts to develop the necessary tools. Clinical scans, as mentioned above, are often characterized with a low resolution in one direction of the scan. Research quality images often demonstrate a resolution of less than or equal to 1mm in each direction, in contrast to 1mm in two directions and 6-7mm in the third for clinical data. Moreover, other image artifacts, due to motion, or the tilt of the head can further complicate automated processing. With the lack of age appropriate templates, the processing of these images can be quite challenging.

The preparation of the data is not simply a matter of getting the files in the right folders. It involves several steps, aiming to homogenize the input images, to allow automated processing. In particular in the case of stroke patients, where so called T2 shine through artifacts (hyperintensities caused by the underlying acute stroke and not related to the chronic disease burden) can play a role, prior knowledge of spatial patterns become important.
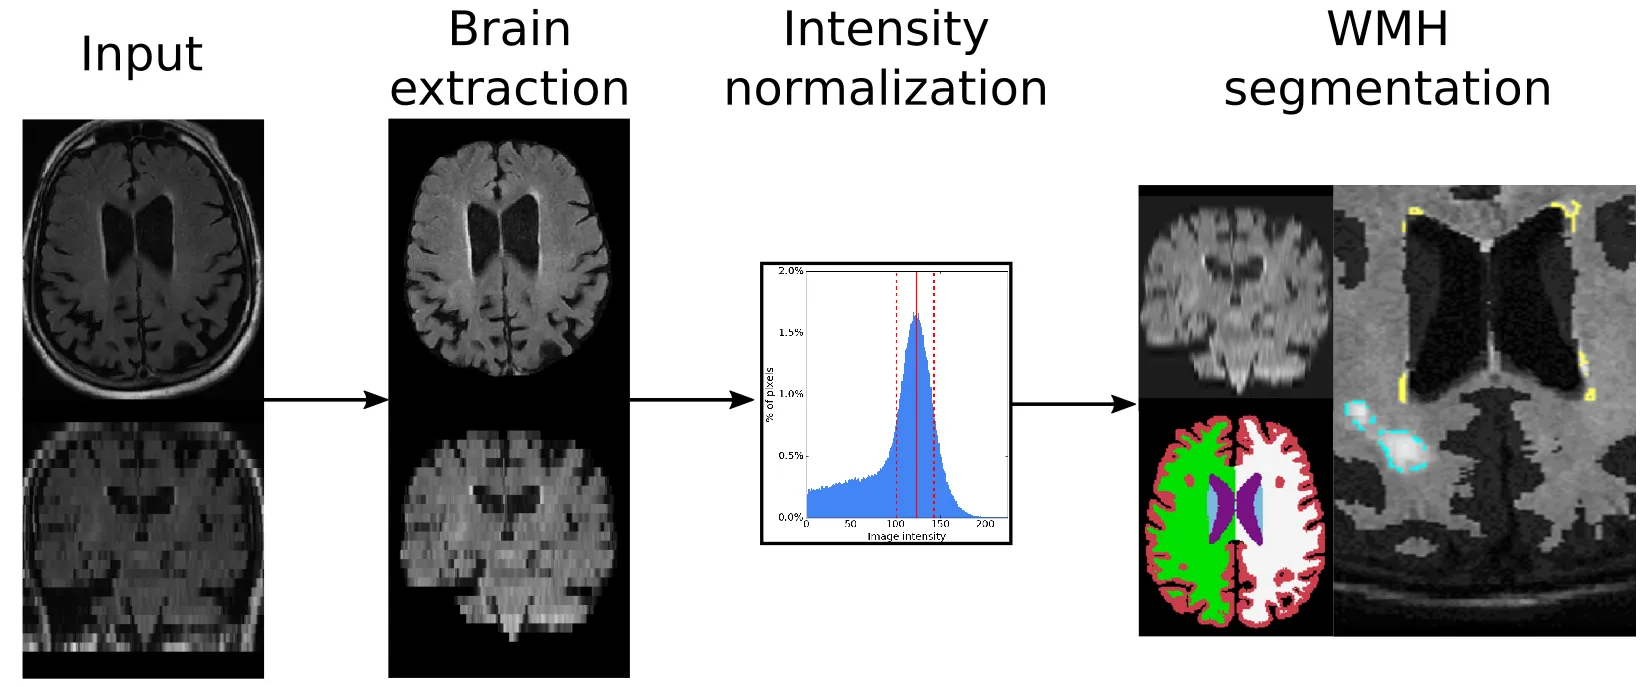
In brief, the preprocessing steps for our algorithm involve brain extraction, intensity normalization, and affine registration to an age appropriate template.
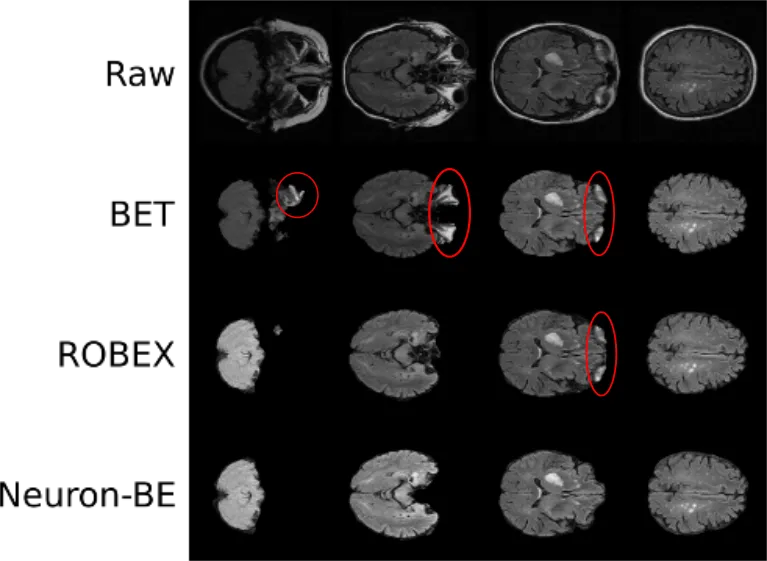
The first step includes the extraction of the brain by removing all non-brain matter, such as skull, eyes, and so on. This step becomes essential, when using intensity based differentiation of brain areas. In addition, it is very important when aiming to utilize spatial priors. An image, linearly registered to a template, would be affected by brain atrophy. The skull will be at approximately the same position for every patient, however, the brain's position will vary. Particularly when working with patients across a large range of ages, as it is the case on population studies, this becomes an important aspect. While brain extraction has been fairly well developed, it often relies on good quality data and subsequently causes 'errors' in clinical data, leading us to develop a deep learning algorithm for brain extraction called Neuron-BE. On the right side you see an example image, where errors are highlighted in red. Both BET and ROBEX are commonly used methods to achieve brain extraction and while they do generally a good job, Neuron-BE outperforms both. We showed this quantitatively by calculating the dice coefficient between manual brain extraction and each of these techniques in a set of 144 patients (12 patients per each of 12 sites from 3 different continents). Neuron-BE demonstrated a median dice coefficient (value between 0 and 1, where the higher the better) of 0.95, compared to 0.92 for both BET and ROBEX.
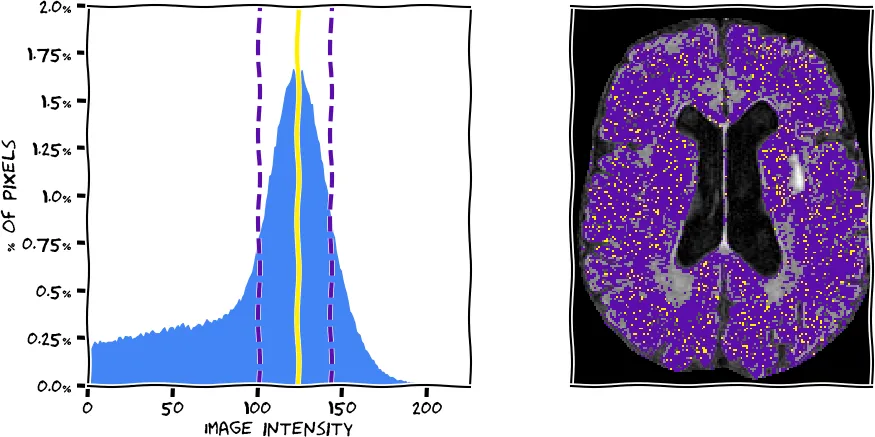
After brain extraction we used intensity normalization to homogenize the input data. This will help the definition of white matter hyperintensities in the later steps, as the algorithm can expect similar intensity distributions between scans. We have implemented a mean shift algorithm based on each brain extracted FLAIR image. The algorithm, in simple terms, finds the highest peak (mode) in the intensity histogram, which corresponds to normal white matter, the largest volumetric part of the brain. In the figure below, you see a histogram extracted from the scan you see on the right (using the information from all slices). The peak was determined with our algorithm (yellow) and the full width half maximum (FWHM) corresponding to this peak was determined (purple dashed lines). The voxels corresponding to the peak and within the FWHM are represented on the brain image in respective colors. We then normalize the intensities by scaling them so that the peak corresponds to an intensity value of 0.75.
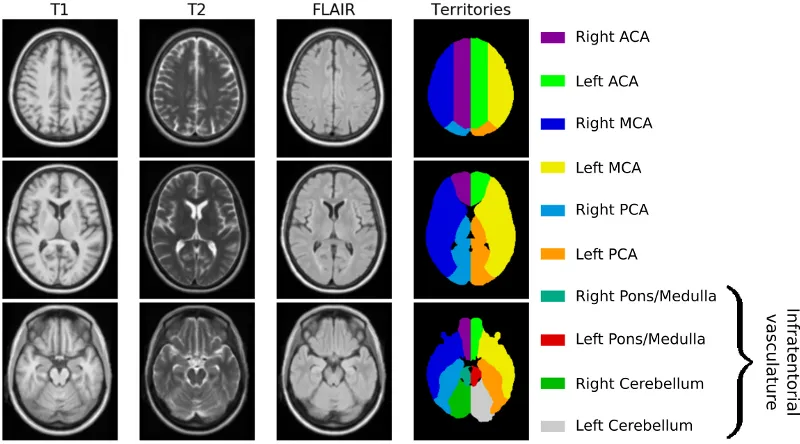
Finally, we register each brain image linearly to an age appropriate atlas. The registration is done using the publicly available Advanced Normalization ToolS (ANTS) framework. Prior to that, we first had to create an age appropriate template. Utilizing data from 16 subjects, recruited between 2016 and 2017 at Massachusetts General Hospital, we generated a high-resolution, multi-model template (using ANTS). The template cohort selection aimed to match characteristics of elderly adults presenting to the emergency department with symptoms of stroke. Data from twelve stroke-free, non-demented patients with the sporadic form of cerebral amyloid angiopathy (CAA), a known cerebral small vessel disorder and four similarly-aged healthy controls were manually assessed to avoid any gross pathology, such as hemorrhage or silent brain infarcts, and a template was subsequently created, as shown in the figure below. Additionally, an expert neurologist outlined the vascular territories on the template (anterior, middle and posterior cerebral artery (ACA, MCA and PCA) territories), which was utilized in a different study to investigate spatial patterns of white matter hyperintensity burden.

There has been a drastic growth of research on deep learning for image segmentation. Deep learning utilizes neural networks, which are connected and can refine features to finally make a decision. Additionally, other elements, such as spatial priors, can be incorporated in the algorithm, helping to improve the final segmentations. Here, we build upon an initial WMH segmentation algorithm, which utilized a PCA based approach for delineating and distinguishing different cerebrovascular pathologies, for example white matter hyperintensities and acute stroke T2 shine-through, on brain MRI. In particular, our model captures disease priors using a convolutional auto-encoder, thereby mimicking experts' knowledge of the spatial distribution of the disease. For training, validation and testing, we use a data set of 699, 91, and 90 manual white matter hyperintensity outlines, which were generated based on data from the GASROS study.
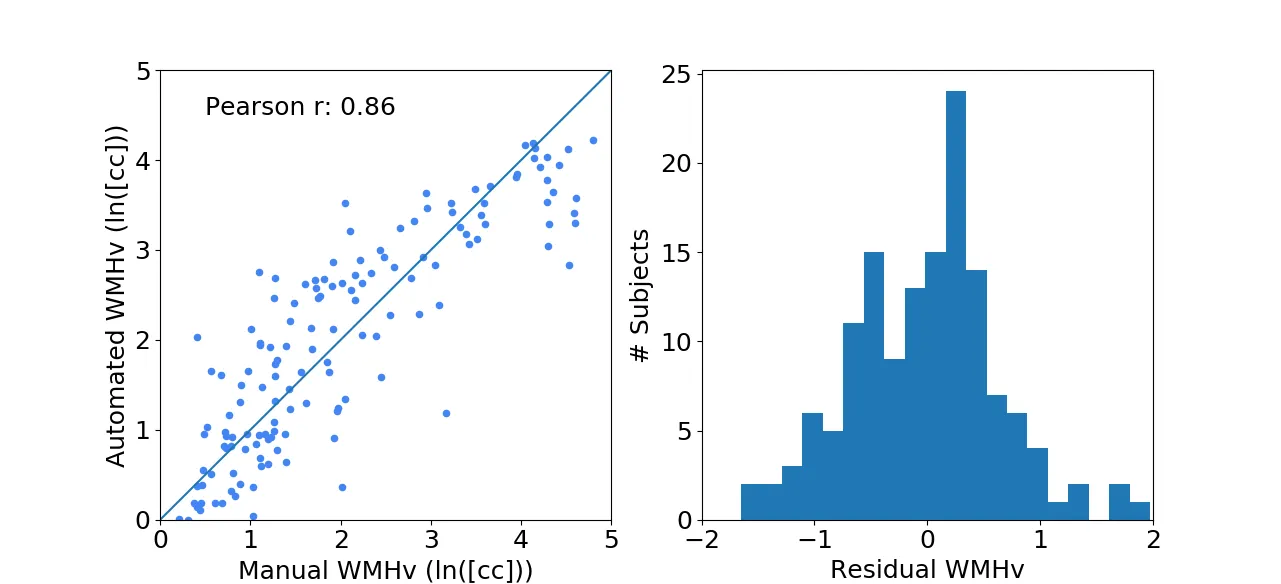
Each new FLAIR image undergoes the same preprocessing steps as described above. We then evaluated the efficacy of the automated WMHv quantification on a set of 144 patients from the MRI-GENIE study (12 sites, 12 patients per site), using Pearson's correlation coefficient as measures of agreement with manual segmentations. The results show good agreement with a coefficient of 0.86, while the residuals (difference between the automatically estimated WMHv from the manual) did not show any trends or biases with respect to age and/or sex of the patient.

We utilized the above methodology to segment white matter hyperintensities in the MRI-GENIE study, a study investigating the genetic contribution to acute and chronic stroke burden. While efforts to acquire more data are still ongoing, we worked with a set of 2,783 stroke patients (mean age: 63.3; 61% male). This set consists of 12 different sites with varying numbers of patients and age ranges. All of the data was directly acquired in the acute stage in the clinic, resulting in large variation in resolutions (mean resolution of 0.7mm in-plane (minimum: 0.4mm, maximum: 1.9mm) and 6.3mm through-plane (minimum: 1.0mm, maximum: 65.0mm).
Working with such a large data set it becomes imperative to include automated quality control (QC) steps, which flags the data that should be manually assessed. At first, we utilize the differences in resolution to determine outliers based on both the in-plane and through-plane resolution. This was done by pooling all scans, calculating the modified z-score and setting a threshold of 3.5. Scans above the threshold were considered potential outliers. Additionally, we flagged scans with low slice numbers (less than or equal 3 slices per scan). This initial step ensures that the data has enough information to return a plausible white matter hyperintensity burden estimate.
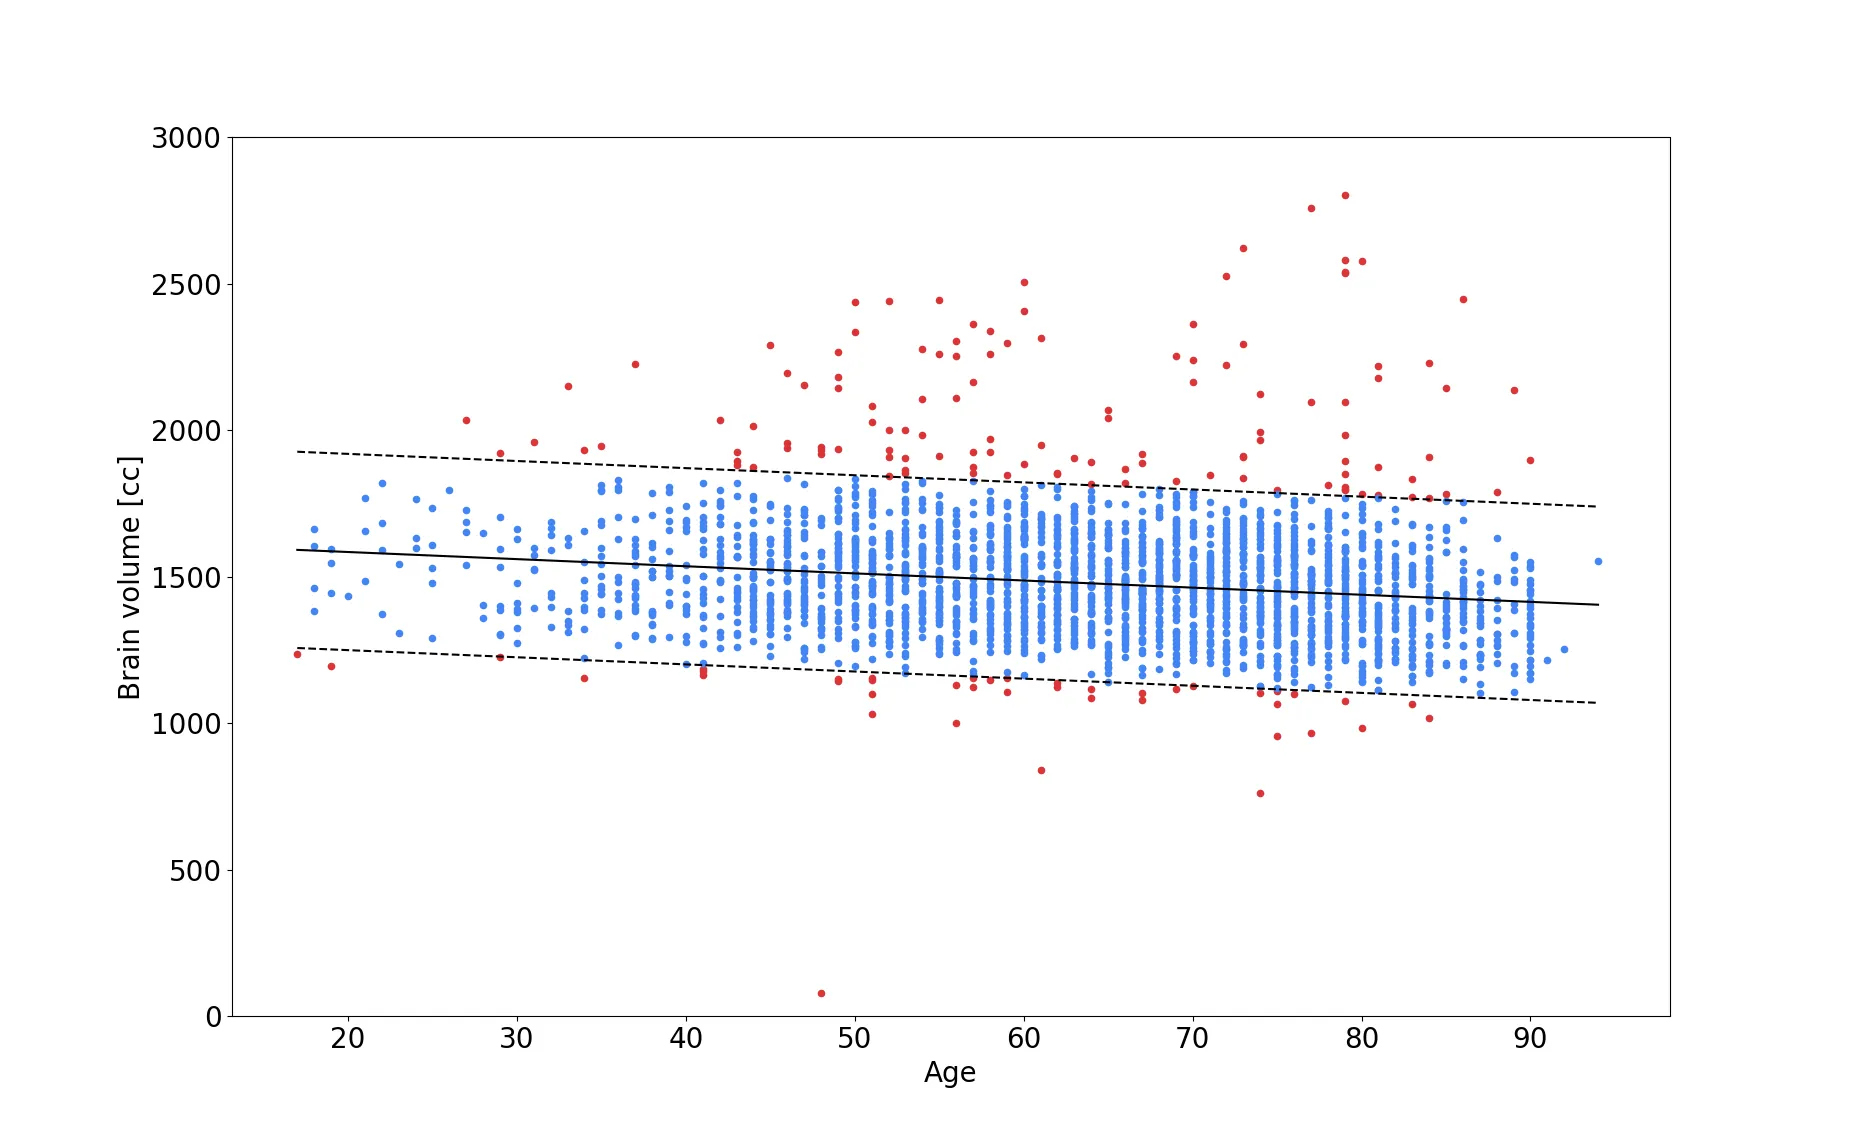
Moreover, we added an additional QC step after brain extraction. By utilizing estimates of expected brain volume, we are able to determine if the brain volume after brain extraction falls within a plausible range and flag the image otherwise for manual QC later on. While this is not a fully automated step, it reduced the workload for the researcher or clinician drastically - in the MRI-GENIE study to about 10% of the data (red dots in the figure above). Finding a good estimate for brain volume, can be difficult to achieve, as general brain atrophy can play an important role and younger subjects might be considered outliers, if the assessment is based on older subjects. In our study, we therefore model the association of brain volume with age (shown in the figure above) and utilize a linear regression, as well as twice the standard deviation (in a Gaussian scenario, this would account for 97% of the variation in the data), as the plausible range of brain volume (blue dots in the figure). This method is particularly interesting, as new, previously unseen data, can be assessed in the same manner.
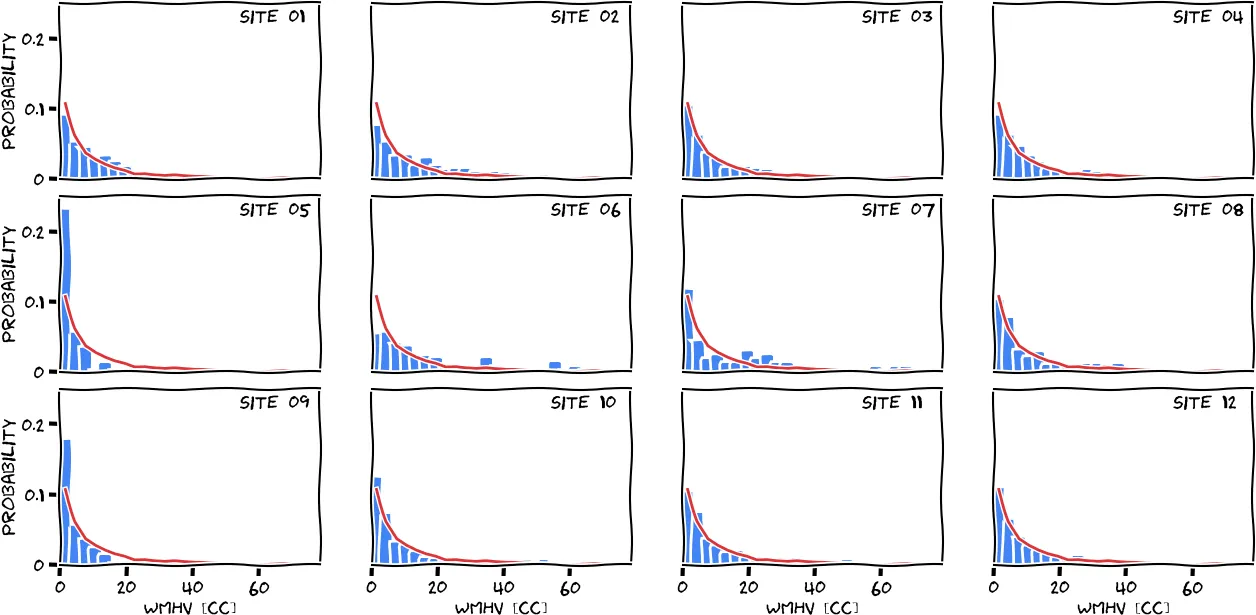
Applying all QC steps described in this section left us with 2533 subjects for which white matter hyperintensity estimates were generated, allowing us to achieve our goal of a fully automated white matter hyperintensity segmentation pipeline for clinical scans. The following figure shows the disease burden distribution of the cohort, stratified by site.