Connectomics
Networks in the brain
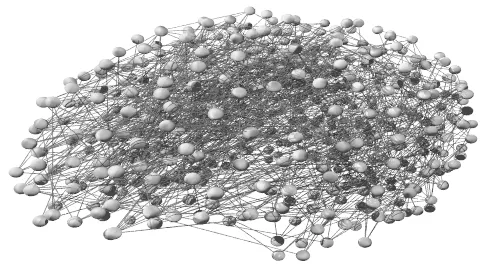
In the brain we usually distinguish between two types of networks, functional and structural. Although the network theoretical background can be applied to both of them, the definition of nodes and edges can be different.
Viewing the human brain as a network originated at the end of the 19th century with the so called disconnection syndrome, where the connection between parts of the brain were disrupted. However the combination of using neuroimaging, for example with MRI, with network theory is relatively recent. The use of network theory in the human brain increased in particular, once it was discovered that the brain topology shares aspects of small-world and rich-club organisation.
For example, structural brain networks are often defined using the following steps. First, the grey matter is divided into regions of interest (nodes). Using diffusion MRI and tractography, the structural connectivity (edges) are estimated between the individual brain regions. Although the exact techniques used to define nodes and edges might differ, the result is a structural brain network which can be used to investigate developmental aspects and the effects of diseases.
Nodes
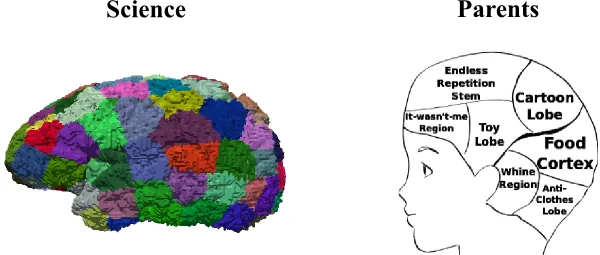
Nodes in a brain graph can be defined on many levels, representing, for example, synapses or entire brain regions. Over the past few decades a variety of definitions of brain regions or parcels were developed based on anatomical landmarks (sulci and gyri) and functional coherence, for example the Automated Anatomical Labeling (AAL) atlas, or using random parcellation methods which define regions based on criteria such as equal region size. Importantly, depending on whom you ask, you might end up with a different definition.
Random parcellation methods are particularly interesting in the developing brain. Developmental processes such as myelination and cortical folding change both the structural and functional aspects of the brain and therefore the definition based on atlases becomes challenging.
Atlases
The most prominent brain atlas was introduced in 1909 by Brodmann, based on the cytoarchitecture, the cellular composition of the brain. Brodmann defined 50 regions on the human brain post-mortem over a set of brain samples. Studies trying to learn the cytoarchitecture of individual parts of the brain are currently being conducted. The efforts, however, are limited by the spatial and temporal resolution of the MRI sequences used.
Another approach defines regions of interest in the brain by using its functional activation pattern measured with fMRI. One atlas which uses this principle is the so called Automated Anatomical Labeling (AAL) introduced by Tzourio-Mazoyer and colleagues in 2002. In their work, they defined 45 regions within each hemisphere, using the underlying sulcation patterns of the brain.
Random Parcellations
In particular during early brain development, when the sulcation patterns are not fully developed, registering the atlas to the changing brain becomes difficult. It has even been indicated that some approaches developed for the adult brain won't work in such populations. This motivates the use of random parcellation schemes which do not rely on the structural patterns of the brain.
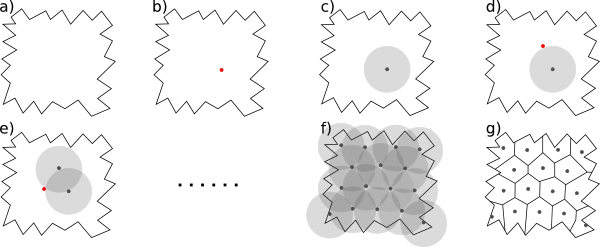
One principles way of generating random parcellations on a 3D volume is based on Poisson disk sampling. It generates regions of approximately equal size, by ensuring that two region centres are not closer than a given threshold. Given any type of volume, Poisson disk sampling first selects a starting centre at random (b). Additional region centres are placed close to the existing region centres, under the condition that they cannot be closer than the threshold (c-f). When there is no space anymore to place an additional region centres, the volume elements are assigned to their closest centre, resulting in a parcellation of the volume (g).
One benefit of random this parcellation scheme lies in the fact that it does not rely on any anatomical landmarks. However, two execution on the same brain might not result in the same number of regions. This is a result of the random nature of the approach and therefore it is important to create many parcellations of the same brain, to avoid biases.

Edges
Once the nodes in the brain are defined, the connectivity or edge structure of the network can be eastimated. Edges may be based on structural relationships, where for example bundles of axons connect brain regions, or on functional relationships, based on statistical or causal associations between functional signals.
Structural networks
Structural networks are commonly defined by using the diffusion information available from diffusion MRI. Once the diffusion data has been gathered, major pathways within the brain can be estimated using tractography. Tractography is a method that integrates voxel-wise (3D pixels) fibre orientation estimates. A variety of aspects have been investigated using tractography and diffusion MRI, such as asymmetry of white matter structure and the evolution of the emerging path-ways and overall fibre organisation. It should be noted that, using diffusion MRI, the direction of movement is degenerate with regard to its sign. In simple terms, both going "forward" and "backwards" along the direction the anisotropy is possible.
Compartment models. In order to infer fibre orientation, one needs to model the diffusion direction in each compartment. That means a model is fitted to the diffusion information, which tries to capture the information of the orientation of the fibres within the voxel. One of the most common models is called "ball and stick", which assumes a combination of the extra-axonal space (in form of a ball) and the intra-axonal space (in form of a stick). Therefore it models the most prominent orientation in the voxel, while accounting for the fact that a voxel is composed of more than just the fibre itself. Multiple sticks might be fitted as well, leading to more than just one principal orientation in the voxel.
Tractography. Once the compartment models have been fitted to each voxel, pathways can be estimated using streamlines through the vector fields of diffusion directions. This process is called tractography. In the discrete case of voxels, diffusion information is averaged across a voxel and streamlines may be represented by a series of connected voxels. In general one can distinguish between deterministic and probabilistic methods.
In case of deterministic tractography, it is common practice to define termination criteria, such as an anisotropy or curvature threshold. Deterministic tractography then uses the voxel wise information to connect the voxels and stops, when any termination criterion is reached. This way the algorithm tries to only account for pathways with a high confidence and discards the rest.
Probabilistic tractography on the other hand, tries to handle uncertainties in the individual voxels mathematically by assigning probability density functions to each voxel. The streamlining process is then repeated many times, in order to sample all paths starting from a given voxel. Each path is assigned a compounded probability, thereby describing the uncertainties of individual paths. The benefit of probabilistic tractography algorithms lies in the possibility of "following" streamlines through voxels of low anisotropy. Moreover, this tractography approach is more robust to noise, as wrong pathways usually disperse quickly. Termination criteria can be very lenient or completely erased.
Functional networks
Functional brain networks investigate the activation patterns of the brain in a time series analysis to describe statistical dependence of regions in the brain. A variety of methods can be used to infer functional connectivity, such as electroencephalography (EEG), magnetoencephalography (MEG) or functional MRI. Two regions in the brain are then assumed to be connected, if there is a statistical relationship between them. However, it is important to distinguish between statistical and causal relationships.
Edge weights. Networks may have weights assigned to their edges, where the weight corresponds to the strength of the connection. There are a variety of methods with which the weights of an edge in the human brain can be determined, however, there is no consensus on which approach is the most appropriate. Weights in structural brain networks are associated with, for example, fractional anisotropy, fibre count or measurements of myelin content, whereas functional networks may use correlations between regions as weights.
These measurements, however, are difficult to interpret when using probabilistic tractography. Two regions within the brain may be connected by two streamlines inferred from probabilistic tractography with different probabilities. The question is then how the individual streamlines should be weighted, considering that the low probability streamline may be wrong. One way to incorporate the probability information from the probabilistic tractography with biological features, such as anisotropy, was proposed by Robinson and colleagues. Applying probabilistic tractography between two regions in the brain results in a set of sampled voxels. Subsequently each sampled voxel's anisotropy in the direction of the streamline can be weighted by the number of times the voxel was sampled, divided by the total number of samples. The sum of all the measurements in the voxels that are part of a tract can then be assigned as weight of the tract.
Topology
Various aspects of the human brain have been investigated over the years. Of particular interest is the understanding of the topology of the brain networks. Once we know the baseline topology of the healthy human brain, we can start investigating differences between that baseline and patients suffering from disease.
Hubs
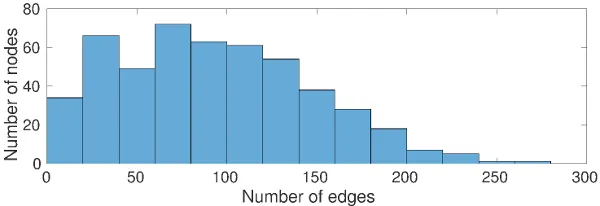
Networks can be assessed based on their degree distribution. If a small number of nodes in the network exist which have a relatively large degree (compared to the average of the network) the degree distribution exhibits a heavy-tail.
Small-world
The small-world phenomenon has become an interesting research topic in the human brain. The human brain is likely to exhibit small-world characteristics, as it is a complex network on multiple levels and over time, supports segregated and distributed information processing and has most likely evolved to maximise efficiency while minimise wiring cost. In a study applying small-world topology to a neural network machine learning algorithm, it has also been shown that small-world networks allow for high rates of information processing and learning.
The existence of small-world topology in brain architecture has been first shown in 1998 by Watts and Strogatz for the structural networks of C. elegans. Following this discovery, brain networks of the cat, monkey and human have been investigated, both functionally and structurally, and it was shown that they exhibit this feature. Small-world architecture has also been of key interest when investigating injury and disease of the human brain.
Rich-club
In general the brain is thought to conserve wiring costs as an important selection criterion as to how and which connections to form. The existence of a rich-club, on the other hand is a high-cost architectural feature. This may seem surprising at first, however, the cost has to be offset against its cognitive value. Many studies have since investigated the consequences of a rich-club in the human brain and found that it is important not only for efficient information transport, but also for functional integration of nodes across the brain. It also seems that rich-club organisation is a general principle for brain networks and scientist have found it to exist in brain architectures of worms, cats, monkeys and humans.
Injury and Disease
Head injuries are a major health issue in most countries around the world. In general it would be beneficial to understand the effects of these injuries on the connectivity of brain. One type of head injury that has been shown to affect network function in the brain is traumatic brain injury (TBI). Pandit and colleagues, for example, have shown that the functional brain networks of TBI patients move away from a small-world organisation with an increase characteristic path-length. In their work they suggest that this increase is due to the damage long-range connection suffer from.
One of the diseases that are of particular interest for network theoretical analyses is Alzheimer's disease (AD). By comparing AD patients to a healthy control group, Supekar and colleagues found that the clustering coefficient of AD patients is reduced. Lo and colleagues on the other hand found that AD patients showed an increase in characteristic path-length. Both results agree, however, that the small-world organisation in AD patients is affected as an effect of the disease.
Another interesting area of research is attention deficit hyperactivity disorder (ADHD). In a study of the functional networks of children with ADHD, Wang and colleagues found that the network organisation of these children becomes more lattice like with an increase in local efficiency. Lattice networks are often associated with an increase in disease tolerance, which may therefore be interpreted as a defence mechanism.
Development
Studying the human brain during early development faces a variety of challenges, such as poor data quality due to movement, small head sizes and the lack of a standard scheme for defining regions of interest in the brain. Nonetheless, studying the developing brain using network theory is of great interest as it is important to characterise the "normal" developmental trajectory. This will ultimately help with the detection and diagnosis of pathological development and diseases at an early stage.
In general it has been shown that the developing human brain shows interesting characteristics, such as an asymmetry between the left and right hemisphere in respect to their network measures, as well as differences related to the sex of the subject. The results for the latter are still inconclusive as there are only a few studies focusing on that particular aspect, but studies suggest that females have a higher efficiency, as well as a higher clustering coefficient, resulting in a more pronounced small-world topology compared to males.
It has been suggested that brain networks develop from a local to distributed organisation. Long-distance connections are generally rare in biological networks. However, they allow for short-cuts within the network and are essential for efficient information transport. Starting from a local anatomical network, the architecture becomes more distributed during development, evolving from a more segregated to a more integrated network structure.
Both small-world and rich-club architecture can be found in the developing brain at an early age. Studies agree on the existence of small-world topology in neural networks over all developmental stages, however, the efficiency increases with age. This is most likely due to the myelination process within the brain, which allows the impulse propagation speed to increase. Additionally, Ball and colleagues showed that the rich-club organisation is present in children by 30 weeks of age and already precedes complex neurological function. However, feeder and local connections were still developing.
Scales
In general one can distinguishes between the mapping of the connectome over multiple levels such as micro- and macroscopic scales, and the multi-scale analysis based on varying the number of regions defined over grey matter. In most studies, networks are defined over a single scale (i.e. a predefined number of regions), by using for example an atlas template. However, the resulting networks are strongly dependent on the number of nodes/regions over which they are defined, which makes comparisons across studies difficult. In particular, it has been shown that network measures vary according to the networks scale, which poses challenges for comparisons.
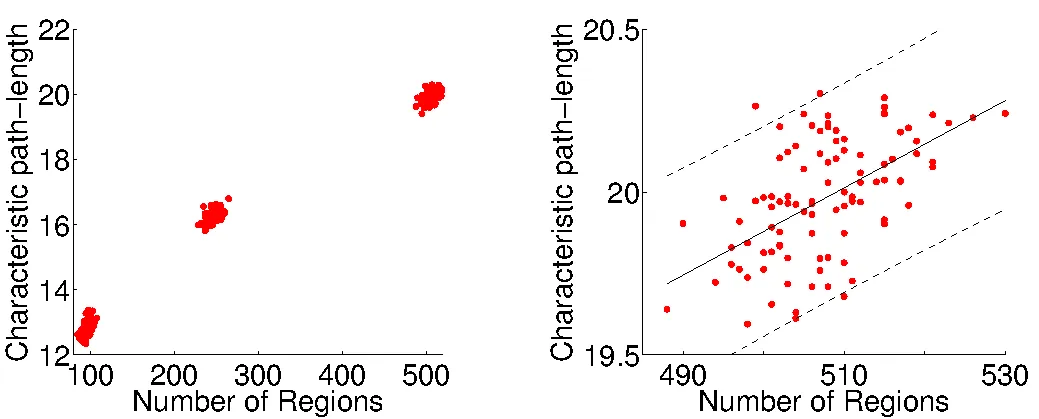
The application of nodal multi-scale approaches has become of interest. Cammoun and colleagues introduce a multi-scale framework using an atlas based segmentation of the grey matter with 66 regions and subdivided these regions further into four additional sets of about 125, 250, 500 and 1000 regions with approximately equal region size. By doing so they aimed to define representative connectivity matrices over multiple scales. Additional studies have compared networks defined over multiple scales in both structural and functional data in adults and the developing brain. These studies mainly investigate whether the conclusions based on network measures are stable across scales and emphasise that a comparison of results across studies should be made with reference to scale.
The right number of regions and their location is still undetermined in neonates (and arguably also for adults). Until the "correct" number of regions has been determined, an analysis over multiple scales is reasonable in order to avoid biases based on the position and number of nodes.